UD-IQ1_S · 93 GB, measured 2026-08-30
Why this is the number, not a complaint: Unsloth's own guidance puts the practical minimum for this model around 102 GB of combined memory; this runs on 42 GB. We couldn't find a single published benchmark of GLM-5.3-Flash below its stated minimum footprint — this is slow because the hardware is 60 GB short, not because the placement is wrong.

Every feature on this page, enabled together. This is the exact command the numbers below were taken from — a 26B MoE model at 64k context on a single 12GB RTX 3060.
GGML_CUDA_MOE_CACHE_TRAIN_PREDICTOR=1 \
GGML_CUDA_MOE_CACHE_SUBSTITUTE=1 GGML_CUDA_MOE_CACHE_SUBSTITUTE_MIN_RANK=4 \
llama-server \
  -m gemma-4-26B-A4B-it-UD-Q4_K_M.gguf \
  -md mtp-gemma-4-26B-A4B-it-Q8_0.gguf \
  --spec-type draft-mtp -bs --jinja \
  --moe-cache auto \
  -c 65536 \
  -ctk q8_0 -ctv q8_0 \
  --expert-atlas-file expert-atlas-evolve.json \
--host 0.0.0.0 --port 8080| Flag | What it turns on |
|---|---|
-c 65536 | The context you want. Expert placement is derived from this — ask for more and the fork moves experts to CPU RAM to fit it, rather than silently shrinking your context. No -ncmoe needed: it resolved to 21 CPU layers on its own. |
--moe-cache auto | GPU-resident cache for the CPU-offloaded experts, LFRU eviction. 79% hit rate warm. Also enables router-lookahead prefetch, which predicts the next layer's experts and fetches them during the current layer's compute. |
GGML_CUDA_MOE_CACHE_TRAIN_PREDICTOR=1 | Live-activation predictor: a small linear layer per model, trained online on the real hidden state each routing decision came from, feeding the same free-slot-only warming path the atlas uses. Self-tuning (no rate constant to guess) and persists its learned weights across restarts. Measured separately, on Ornith-1.5-35B: +0.12pp hit rate, 3/4 rounds — see the proof table below, not part of this command's own gemma-4 numbers. |
GGML_CUDA_MOE_CACHE_SUBSTITUTE=1 _MIN_RANK=4 | On a miss, serve a resident stand-in from the router's own other top-k picks instead of paying CPU fallback — gated to only the router's least-confident picks (rank≥4) so its most consequential choices always get exact compute. Measured separately, on Ornith-1.5-35B: +8.11% tok/s, 4/4 rounds, hit rate unchanged (it can't move that metric by construction) — see the proof table below. |
-ctk q8_0 -ctv q8_0 | 8-bit KV cache — halves it (2,180 → 1,158 MiB) and the freed gigabyte automatically becomes two more expert layers on the GPU. Verified lossless here: identical outputs, full needle recall at 24.7k tokens. Keep K and V the same type or you fall off the fused Flash Attention path. |
--spec-type draft-mtp -md | Multi-token prediction with the draft model. ~0.6 draft acceptance here. |
-bs | Backend sampling. |
--expert-atlas-file | Feeds the Brain view expert positions instead of an arbitrary layout. Use the discovered/evolving atlas from scripts/moe-atlas-evolve.py (co-activation-derived, persists and settles further with more traffic) rather than the static 9-topic-probe atlas from llama-expert-atlas — same file format, either works, but the discovered one is what the Brain view's layout was actually designed around. Cells serving as a live substitution stand-in flash yellow in the same view. |
Measured on that command (predictor/substitute env vars not included in this specific run): ~64 tok/s generation warm (61.8–66.3 across runs), 4 concurrent slots. The first request after startup runs nearer 35 tok/s and climbs as the expert cache fills — the steady-state number is the honest one to plan around, and the cold one is the honest one to expect. The predictor and substitute numbers above are real but come from a separate hardware/model pairing (Ornith-1.5-35B) - not yet re-measured on this exact gemma-4 command.
Two optional extras, deliberately not in the line above. --cache-disk DIR persists the
prompt cache so a restart costs 271ms instead of 5.8s — but it writes prompt content to disk (owner-only,
model-fingerprinted), so it is opt-in on purpose. And GGML_CUDA_VMM_KV=1 reserves KV lazily,
committing only what a conversation actually reaches.
Running a genuinely large model used to mean a rack of enterprise GPUs, or accepting whatever a hosted API gives you. The core unlock here — a GPU-resident cache for CPU-offloaded MoE experts — means a 26B-parameter MoE model that can't fit in a 12GB card doesn't just technically run: it runs fast, on a single consumer GPU. That's the whole point: put capability that used to require a data center within reach of hardware someone actually has on their desk.
But a fork that just claims speedups is exactly as trustworthy as any other unverified benchmark. So the second half of the project is making sure every claim can be checked: numbers are measured before/after on real hardware and reported honestly even when they're a loss (see the FR-Spec row below), and the cache itself is watchable live — not "trust me, it's caching," but a real-time view of which experts are hot right now. Prove it, then ship it, then let you go verify it yourself. Not a fork chasing every upstream feature — one willing to slow down and prove each claim before it ships.
Scope, honestly: the expert-cache fits the model's parameters into limited VRAM - it
doesn't and can't stretch VRAM to hold arbitrary context length, which is a separate resource that scales with
sequence length regardless of how the weights are cached. Pushed this to a real boundary on our own 12GB card:
requesting 1M context used to hard-crash the whole process rather than fail gracefully - found and fixed that
(--fit now searches by doubling from a safe floor and lands on a real, measured context size
instead of guessing or crashing). A physical ceiling still exists - ask for 1M on a 12GB card and you will not
get 1M - but it sits much higher than we first reported, and finding out why was the more useful result.
The first version of that fix asked the wrong question. It picked a placement, then shrank context until the model fit around it - so a 12GB card landed on 8192 tokens/slot, and we wrote that down as the hardware ceiling. It wasn't. The expert placement had been fixed first (by a command-line flag nobody revisited), and context was quietly paying for it. Inverting the order - decide placement from the context actually asked for, pushing more expert weights to CPU RAM until the request fits - gives 65,536 tokens across 4 concurrent slots on that same card and model, 8x the context and 4x the concurrency, at higher throughput than before. Nothing about the hardware changed; the program simply stopped trading away the one thing the user explicitly asked for. The lesson we'd pass on: when two automatic systems each optimise locally, check what the pair does to the number the user actually cares about.
Every number below is from the same machine - an RTX 3060 with 12GB, a 26B MoE model, a SATA SSD - measured before and after, and reported whether or not it flattered us.
Context that follows the request, not the flag. Placement used to be chosen first and context shrunk to fit around it; now the requested context is fixed and expert placement gives way to it. Same hardware, 16× the context and 4× the concurrency.
Restarts stop costing a re-read. The prompt cache now persists to disk keyed by content hash, so a 3,600-token document that cost 5.8s to process is restored in 0.27s after a full restart. Files are owner-only and model-fingerprinted - they contain your prompts, and the docs say so plainly.
KV cache quantization that pays for itself twice. Symmetric q8_0 halves the conversation cache (2,180 → 1,158 MiB), and because placement is derived from measured memory rather than a fixed flag, the freed gigabyte automatically becomes two more layers of experts on the GPU - no code, no tuning. Verified lossless here: 6/6 byte-identical outputs at temperature 0, and full needle recall at 10/50/90% depth of a 24,700-token prompt.
And the ones that didn't work, because a fork that only publishes its wins is the thing this project exists not to be: pinning hot experts in RAM measured worse than doing nothing and ships disabled; page-cache readahead gained 5% on the first request and cost 8% thereafter, so it ships disabled too; and a claimed “+21% to +50%” speedup was retracted outright once measured properly - it was a single noisy sample, and the real effect is about 5%. The benchmark harness that caught it is in the repository.
solid.cpp tracks llama.cpp upstream directly and
layers on a curated set of performance and correctness fixes — triaged from real, reported issues, root-caused in
code, and validated with actual measurements before anything is kept. Every change here is either a measured win
or a documented, honest "no": a fix that was tried, found not to be the cause, and kept anyway if it was
independently valid, or reverted if it wasn't.
The starting focus was MoE expert-cache placement and speculative decoding, but the scope covers the whole inference hot path — kernels, batching, KV-cache, sampling, quantization — and, increasingly, whether you can actually see what any of it is doing while it runs.
Every number below is a real before/after on the same hardware (RTX 3060, 12GB VRAM — about as constrained as it gets for a 26B-parameter MoE model), same prompt, same config except the one thing being measured. Chat-templated and content-verified, not a synthetic benchmark.
Every row below is a real tok/s (or pp2048 tok/s) before/after on this hardware, ordered smallest gain to largest so the table reads as a rising case, not a grab-bag — each row is still its own independent A/B, not a single chained run, since these were measured at different points in the session's real history and some are pp2048 (prompt processing) rather than tg (generation).
| What | Before | After | Change | |
|---|---|---|---|---|
Real placement optimum (vs a conservative -ncmoe guess) | 46.995 tok/s | 51.71 tok/s | +10.0% | solid |
Native full-tensor prefetch double-buffer (GGML_SCHED_PREFETCH_EXPERTS — found shipping disabled, now safe to opt into) | 951.77 tok/s | 1072.96 tok/s | +12.7% | solid |
--moe-calibrate empirical search (vs safe-floor placement) | 41.68 tok/s | 50.70 tok/s | +21.6% | solid |
| MTP speculative decoding | 50.70 tok/s | 64.92 tok/s | +28.1% | solid |
MoE expert-cache (vs --moe-cache off) | 39.37 tok/s | 51.71 tok/s | +31.3% | solid |
| Expert-prefetch, prefill (overlapped weight uploads, ncmoe=20, pp2048 — via thecodacus) | 1403 tok/s | 1908 tok/s | +36.0% | solid |
| Buffer fed by prediction (vs fed by historical heat, 5 GiB cap) | 3.74 tok/s | 5.26 tok/s | +41% | solid |
| Frozen expert-cache bug (budget latch, found live) | 37.2 tok/s | 61.3 tok/s | +65% | solid |
Not every real result is a tok/s number — some are context/VRAM capacity, hit-rate improvements too small to move tok/s yet, live-found bugs, or losses reported because a fork that only publishes wins is the thing this project exists not to be.
| What | Before | After | Change | |
|---|---|---|---|---|
| Speculative eviction, single guess (refuted across 3 different memory-pressure regimes) | 3 regimes | -35% / -16% / -15% | refuted 3× | refuted |
| Cross-depth-agreement eviction (a closer depth must confirm a farther one before evicting; 200-tok run) | 76.5% hits | 77.3% hits | fewer evictions, more hits | solid |
| NVMe migration (model reads, SATA → PCIe NVMe) | 0.50 GB/s | 2.9 GB/s | 5.8× | solid |
| Expert-cache size knee (sweep 1/2/4/6/8 GiB, production shape) | 7.4–8 GiB | 4 GiB, same tok/s | 3.5 GiB freed | solid |
| Low cache-size placement collapse (2,048 MiB request starves the fit search) | 4 slots | 1 slot | collapsed | found live |
| Router-lookahead ranking fix (missing sigmoid + load-balancing bias) | raw logits | sigmoid+bias | fixed | solid |
| Brain/atlas UI (upstream #22937 defaulted the build to a prebuilt HF bundle) | stock square | atlas | restored | solid |
TurboQuant V cache (WHT+Lloyd-Max vs q4_0, real V, matched 4.5 bpw — no outliers to remove on this axis) | 0.0475 err | 0.0500 err | worse | not built |
| Fit margin dropped to 0 (the margin also covers post-probe allocation, not just placement uncertainty) | 65536 ctx | 4096 ctx | collapsed | reverted |
| FR-Spec draft-vocab trim (measured, not assumed free) | 75.93 tok/s | 56.2 tok/s | -26% | solid |
Context + concurrency from placement fix (-ncmoe 15 -c 65536, same command, same root fix) | 4,096 tok / 1 slot | 65,536 tok / 4 slots | 16× / 4× | solid |
| Restart re-prefill (disk prompt cache, 3,623-token prompt) | 5,775 ms | 271 ms | 21× | solid |
KV cache size (q8_0, 65,536 ctx × 4 slots) | 2,180 MiB | 1,158 MiB | -47% | solid |
| Host-resident hot-expert holding (2 variants tried, both worse — dedicated buffer -56%, mlock pinning -12%) | 2 variants | -56% / -12% | both worse | solid |
| Usage-history pre-warm (claimed +21–50%, retracted after a 5-round harness; re-measured) | 96 D2D hits | 121 D2D hits | +26% hits, tok/s unchanged | solid |
| Router-lookahead prefetch (next layer's experts predicted, filled early — confirmed still firing live, 232 calls/short run) | 88.3% hit rate | 89.4% hit rate | +1.1pp | solid |
| LFRU hit/miss split for prefill (device-to-device for resident experts — design from FreeToken; the buffer it rides on costs 5%, see row below) | 0 D2D, always PCIe | 65 D2D hits, warm | mechanism works, see below | superseded |
moe-cache prefill double-buffer, measured at last (GGML_CUDA_MOE_PREFILL_BUFFER — distinct from the +12.7% flag above; Gemma-4 only, pp2048) | 953.00 tok/s | 905.35 tok/s | -5.0% | refuted |
| Silent corruption under copy failure (a failed prefill copy still published its slot — fixed, verified with deterministic fault injection) | 122 prefill hits, garbage out | 19 hits, correct out, loud disable | fixed + validated | solid |
| Low draft-acceptance warning (Ornith's MTP head drafts at 0.19 acceptance, runs ~2× slower — now diagnosed, not silent) | silent 2× slowdown | warns once, names the cause | diagnosable | solid |
| Stale LFRU hit-mask corruption (a shared hit bitmask vs. per-tensor LFRU residency — bisected, root-caused, fixed) | corrupts reliably, 2nd of 2 sequential prompts | verified clean across repeated varied prompts | fixed, root cause | solid |
| Sentinel expert-id (−1) handling (an assert, an off-by-one, and an OOB read, all from one unhandled sentinel id) | assert / OOB risk | sentinel skipped correctly | fixed | solid |
Recurrent-state dtype, Gated DeltaNet/KDA (new -ctr/-cts flags — needed a new F16 ggml_cuda_op_scale kernel too) | 62.81 MiB (f32) | 31.41 MiB (f16) | -50% | solid |
Explicit pread() for cold expert fetch (vs. mmap demand-paging — fill mechanics were never the bottleneck here) | 750.4ms | 729.3ms | within run-to-run noise | no gain here |
| Topic-affinity atlas cache warming, iterated to a real win (3 designs tried in sequence — thin/wide eviction, then free-slot-only admission) | 3 designs | -0.31 / -6.55 / -0.35pp | unwound in order | superseded below |
| Live-activation MoE predictor (two graph-discovered alternatives lost decisively to the hand-picked atlas on link-prediction AUC) | 0.71 vs 0.57/0.49 AUC | 40-45% top-1 (~3% chance) | real signal, not noise | solid |
| Predictor-driven warming, self-tuned and persisted (free-slot budget floor + live evidence ratio, both self-tuning; weights persist across restarts) | off (no warming) | +0.12pp hit rate, 3/4 rounds | first real win, post-atlas | solid |
| Substitution, rank-gated draft/fallback (exact fallback above a router-rank floor, cheap resident stand-in below it) | 55.12 tok/s | 59.59 tok/s | +8.11%, 4/4 rounds | solid |
Several of those rows are losses, and they are deliberate. Speculative eviction failed three separate times before cross-depth agreement fixed it. FR-Spec was expected to be a free win and wasn't. The host buffer and mlock pinning both tried to hold hot experts in RAM and measured worse than doing nothing. The prefill double-buffer that carries the device-to-device path turns out to cost 5% — measured only after it had been shipped (off by default) and cited for a year on the strength of a different flag's benchmark. That last one is the uncomfortable kind: not a failed experiment but a claim that was never actually tested, and the correction cancelled a planned piece of work rather than starting one. That's the actual point of solid.cpp: every number here is something that was measured and would be reported honestly either way. Full raw numbers, per-row methodology, and the complete working log — including dead ends — live in docs/moe-cache-colibri-notes.md and docs/plan.md.
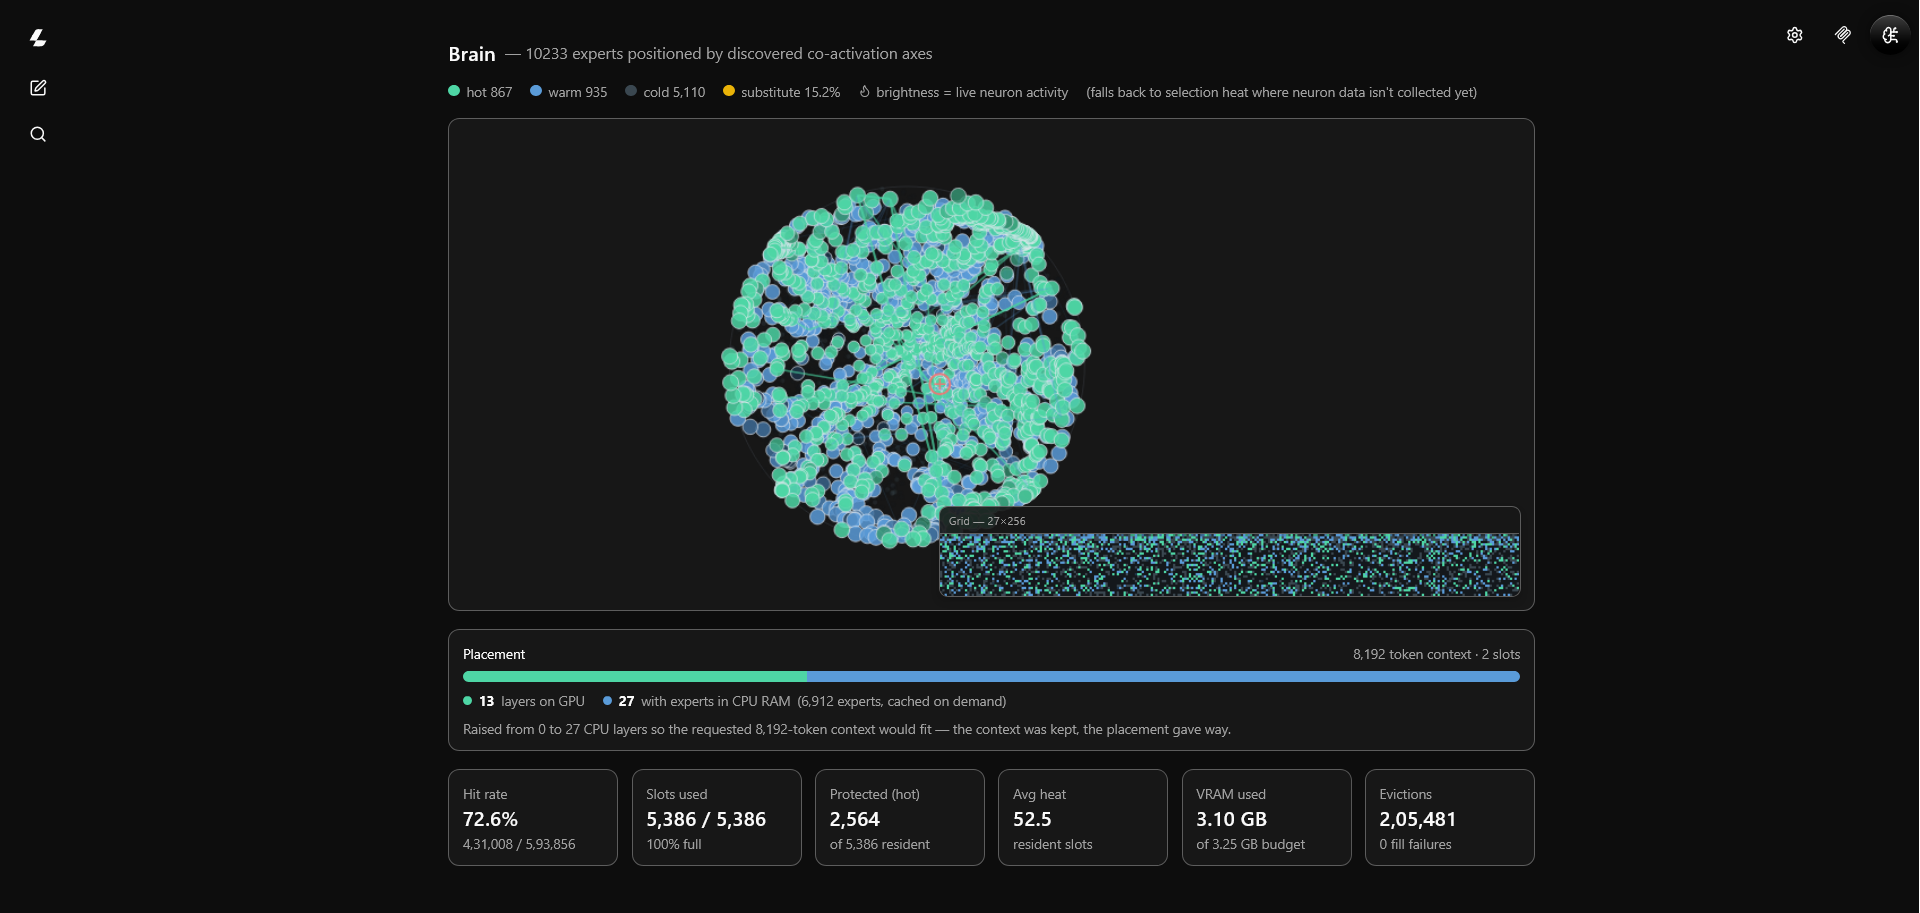
A cache you can't see into is a black box you have to take on faith. The Brain view polls the running server and renders, live, which experts are actually resident in GPU memory right now — cold (never cached), warm (probation), or hot (protected) — with real-time hit flashes as tokens route through them.
Merged into the same view: the Atlas — each expert positioned by measured topic affinity (code, math, law, medicine, and five other categories, probed with greedy decode and a replication gate so one lucky prompt can't fake a specialist), colour still driven by live cache state. Position from measurement, colour from reality, one canvas. Cells flash yellow when serving as a live substitution stand-in — a resident expert doing someone else's work rather than the router's own missed pick paying CPU fallback.
What building this actually caught: live-testing the Brain view against real traffic surfaced
a genuine, previously-undiscovered engine bug — under backend sampling (-bs), the entire moe-cache
session was silently destroyed and rebuilt empty on every request, because its lifetime was tied to a scheduler
object that gets torn down and recreated whenever a new sampler is attached. The cache was working for exactly
one request, then quietly doing nothing, with no error or warning. Root-caused with temporary per-call logging
(not guessed at), fixed by detaching the cache session from the old scheduler and re-attaching it to the
replacement instead of recreating it from scratch. This is exactly why the "proven, not promised" numbers above
matter — a feature that silently stops working is worse than one that was never built, because you don't find out
until you go looking.
Every expert gets a position from measured topic affinity: probed offline across nine categories with greedy decode and a replication gate, so one lucky prompt can't promote an expert to specialist. The map is genuinely predictive. The finding that matters is that being predictive doesn't reach the running system at all.
As a map, it holds up. Tested on link prediction — “do these two experts fire together?” — against embeddings factored directly out of the observed co-activation graph, on 31.6× more data than the atlas ever saw:
| Method | AUC |
|---|---|
| Popularity control (expert frequency alone) | 0.5437 |
| Incremental / online-learned atlas (AdaGrad, 178M steps) | 0.4823 — chance |
| Discovered co-activation embedding (64 dims) | 0.5761 |
| Probe atlas (9 categories) | 0.7116 |
The probe atlas predicts co-firing better than an embedding built from co-firing itself, having never seen that traffic — a result from a test designed to be fair to the alternative. Two successive attempts to replace the nine hand-chosen categories with something label-free both lost.
Then the same two maps were run through the live server, and were indistinguishable. Probe atlas (AUC 0.7116): 58.45 tok/s, 71.20% hit. Incremental atlas (AUC 0.4823, i.e. chance): 58.43 tok/s, 71.28% hit. A map scoring at chance performs exactly as well in the running system as one scoring 0.7116, on the original rate-limited, admission-gated design that supplied roughly 2% of fills. The map's advantage is real as a statement about maps and never reaches the mechanism consuming it. Any claim that one atlas beats another now has to say which of the two things it means.
That 2% figure is from the original design; a later rebuild (free-slot-only admission, a wider candidate pool, burst-mode firing on a detected topic shift) touches roughly 22% of decisions instead, and fixed two designs measured actively harmful (−0.31pp, −6.55pp) along the way. Current honest state: safe, not harmful, but still short of a consistent win — post-switch pooled hit-rate delta of −0.35pp overall, with individual topics mixed rather than uniform (one, law, is a real +0.40pp win, 3 of 4 rounds). Ships off by default either way.
Why the ceiling is that low is the deeper answer: atlas warming gains +0.31pp hit rate in simulation, while a topic oracle with perfect foreknowledge of the segment's experts gains +0.30pp. The atlas is already at the ceiling. Every topic touches ~6,000 of 7,680 experts and the top 1,000 cover only 52–61% of selections — there is no compact topic hot set to preload, so no prefetcher of this shape can win. One result explaining an entire family of refuted experiments is worth more than the feature would have been.
So the atlas ships as what it demonstrably is: the spatial layer of the Brain view — position from measurement, colour from live cache state — with its warming path rate-limited, admission-gated and off by default. Related reversals were reported the same way: combining atlas admission with eviction-weighting went net negative (−0.95pp, 1 of 4 rounds) against admission alone (+2.75pp, 4 of 4); and hit rate itself turned out to be purchasable — 79.25% is available for one environment variable and a slower server, which is exactly why throughput, not hit rate, is the objective here.
Caching decides which experts live in GPU memory. But an expert is not atomic — inside one, some neurons carry almost all the signal and others contribute essentially nothing. This fork measures that directly, per expert, and serves the ones that matter at reduced width.
The measurement came first, and it changed the design twice. Concentration is scored by value, not rank: “top 25% of neurons” picks a fixed cutoff regardless of what that expert's distribution actually looks like, so instead each neuron is compared against a threshold relative to its own expert's maximum, and the resulting count falls out as an observation rather than an input. Dead-neuron fraction is anchored on the median, not the mean — these distributions are skewed enough (max/mean ratios of 120–270× measured) that the mean is not a trustworthy reference.
| What was measured | Result |
|---|---|
| Neurons clearing 25% of their expert's own max | hold ~81% of that expert's total activation mass |
| Per-expert width needed for 90% coverage | bimodal — median ~83%, but a real minority need as little as 6–7% |
| Shared index set across a layer's experts | retains only 55.9% of mass — proof the selection must be genuinely per-expert, not one set reused |
| Per-layer miss rate vs. concentration | decoupled (12.1–16.0%, flat) — today's cost is uniform precisely because nothing yet exploits concentration |
An early read of the per-layer medians said layer 0 was uniquely concentrated (30.9% dead neurons vs ~0% everywhere else) and the mechanism was nearly scoped to that one layer. Checking at the individual-expert level instead found 17 more outlier experts scattered across layers 1, 2, 3, 4, 37 and 39, some on large sample counts. The layer median had been hiding a real per-expert effect that exists everywhere, just unevenly. The shipped mechanism is layer-agnostic because of that check, not despite it.
Converted experts are served from a second, narrower cache pool: gate/up only
(down_exps's row axis is an output dimension, where dropping rows would delete real outputs rather
than approximate sparsity), the chosen rows gathered once at fill time, and a small CUDA kernel scattering the
computed values back into their correct positions in an otherwise-zeroed row. The CPU path never learns any of
this exists. Measured 50% VRAM saved on every converted expert, and the reduced pool evicts
under the same heat-driven LFRU policy as the primary one, so it keeps tracking whichever experts are currently
hot instead of freezing at whoever converted first.
What building this actually caught — three times, and only by measuring: every one of
these looked correct on inspection. (1) Taking the cache's core lock on every hit cost
16% throughput (35.56 → 29.89 tok/s) — the exact regression shape an earlier
dedicated mutex already existed to prevent, reintroduced. (2) A full session decided
20,201 conversions and placed zero of them: greedy pool admission consumed the entire budget
first, so the reduced pool never had room to exist — pure overhead, no benefit, completely silent.
(3) Reduction was being applied to down_exps, which the design explicitly
excludes; the restriction had been written down but never coded. The fix for (2) then failed twice more on its
own, each time visible only in the pool table: reserving a flat slice starved a whole primary pool out of
existence and dropped hit rate 31.3% → 23.1%, costing far more than it saved.
Chasing why the neuron work only bought 8%, the utilization numbers said something else was wrong: CPU at ~5.4 of 12 cores, GPU at 41%, and ~3 GB of a 12 GB card unused. Neither resource saturated means the bottleneck is serialization, not capacity.
Placement reserves 3 × --fit-target of VRAM before deciding anything, and that
reservation silently raises a requested -ncmoe until the context fits. With the 1024 MiB
default that is 3 GiB held back — and it invalidated an entire sweep before being noticed: requesting 22,
16 and 10 CPU layers all produced identical memory use and near-identical throughput, because all three were
being raised to 27. The log line saying so had been there the whole time.
| --fit-target | Effective CPU layers | tok/s | GPU memory used |
|---|---|---|---|
| 1024 (default) | 27 | 47.32 | 8951 MiB |
| 640 | 24 | 50.37 | 10307 MiB |
| 448 | 23 | 51.61 | 10741 MiB |
| 320 | 22 | 52.85 | 11237 MiB |
+11.7% from the margin alone (~+30% against the starting configuration), every candidate passing its correctness check, on Ornith-1.5-35B. The margin cannot simply be deleted — it covers allocation that happens after the fit probe can see it, and removing it reproduced a hard context collapse — so the honest answer is to measure it per machine rather than ship a constant.
And the tightened margin is not universally good, which is the entire argument for calibrating it.
On gemma-4-26B the result inverts: the default margin scored 71.86 tok/s while every tightened
value scored ~50. Opposite of Ornith. Any single constant would have been wrong for one of the two models no
matter which was chosen. --moe-calibrate now searches this dimension and records it alongside
placement, threads and cache size — and the first real run of that new search promptly exposed a bug in
itself, comparing candidates against a baseline measured under a different cache size and nearly shipping a 29%
regression as a “calibrated optimum”. Caught by reading the numbers it printed, fixed, re-run.
GPU-resident hot-expert cache for CPU-offloaded MoE layers. LFRU eviction (capped SLRU + heat tiebreak), live
auto-placement, --moe-calibrate for empirical, concurrency-aware placement search instead of a fixed
guess.
Real-time per-expert tier/heat heatmap merged with measured topic-affinity positioning, served straight off the running server — see above.
Overlaps an offloaded expert's weight upload with the previous expert's compute, plus lifetime host-page pinning
for -ncmoe's CPU→GPU copies. +36.0% prefill — ported from
thecodacus.
Prefetch now checks per-expert residency against the cache decode already fills: a resident expert copies device-to-device instead of re-fetching from host memory. Design from FreeToken, re-derived against our own cache — zero regression on a cold cache.
GGML_CUDA_MOE_CACHE_LIVE_PREFETCH, default on)The live-activation predictor already ranked candidates and the cache already tracked per-expert CPU cold/warm
state — admission just never acted on it. Now hints the kernel to start reading a cold candidate's host pages the
moment it's queued, not when the fill worker actually needs them. A/B'd under real memory pressure (5 rounds each,
15 GiB cap): 29.1 → 39.8 tok/s mean, and it specifically kills the worst-case stalls (17 tok/s low end
gone) rather than just nudging the average — unlike the older one-shot READAHEAD flag (blind,
history-based, a measured net loss on warm throughput), this only fires for a candidate already independently
wanted.
Eviction now weighs heat by an NVMe-vs-RAM cost tier, so a hotter-but-cheap slot can lose to a colder-but-expensive one. A correctness fix for real memory pressure, not a throughput win — noise-neutral under normal load.
SPEC_EVICT_MODE=agree, default)Only lets a closer, more accurate depth's prediction confirm a farther depth's guess before evicting — fixes
the regression the old any policy had at depth≥3. Default now, inert unless
GGML_CUDA_MOE_LOOKAHEAD_DEPTH>=2 is set.
--spec-prob-accept accepts a draft token whenever the target considers it at least as likely as
the draft did, not only on exact match. Opt-in, verified byte-identical when off.
MTP draft-vocab trimming with its real cost measured directly — a genuine trade of throughput for VRAM, not a free win, plus a cache-correctness bug found and fixed along the way.
p_min footgun warningA diagnostic that fires when a drafter's confidence early-stop is left disabled while draft width has been raised — mirrors the existing concurrency-cliff warning pattern.
LLAMA_DEBUG_VERIFY=1 gates zero-cost-when-unset traces that were directly responsible for finding
more than one of the fixes on this page.
An explicit -c request too large for VRAM used to abort the whole process - upstream's --fit
only auto-adjusts unset arguments. Now searches by doubling from a safe floor and lands on the real,
measured context that fits instead - see above for how this one was actually found.
A garbled, repeated-character output bug, git-bisected and root-caused: the device-to-device hit bitmask is
legitimately shared across gate_exps/up_exps/down_exps, but LFRU residency
is tracked per tensor — a bit cleared for one left the others neither device- nor host-copied, reading garbage
as weights. Fixed by separating the shared routing bitmask from a fresh per-tensor copy mask.
-ctr/-ctsGated DeltaNet/KDA's recurrent state was hardcoded F32 with no override, unlike K/V cache's
-ctk/-ctv. New flags mirror that pattern; f16 halves the footprint (62.81 → 31.41
MiB) with output verified coherent — needed a new F16 ggml_cuda_op_scale kernel underneath it too.
A small linear layer trained online on the real hidden state each routing decision came from, feeding the same free-slot-only admission path the topic atlas uses. Self-tuning throughout, weights persisted across restarts. 40–45% top-1 accuracy from a cold start (~3% chance); +0.12pp hit rate, 3/4 rounds — the first mechanism here to beat the no-warming baseline on repeat measurement.
The core goal of llama.cpp — minimal-setup, state-of-the-art LLM/VLM inference on a wide range of
hardware, locally and in the cloud — carries through untouched:
--spec-type draft-dflash
(DFlash, block-diffusion parallel drafting, up to 6×
lossless speedup) and --spec-type draft-dspark
(DSpark, DeepSeek's confidence-scheduled semi-autoregressive
Markov-head drafter, 16–18% higher accepted length than DFlash) — full convert-script and README
coverage in docs/speculative.md.
Not something this fork ported: real, working, upstream-inherited support, checked and confirmed present
rather than assumed. DFlare (scales draft capacity further
past DFlash) is a newer successor worth watching, not yet implemented anywhere.Built on top of ggml. See upstream's own manifesto and API references for lib llama and llama-server REST.
cmake -B build -DGGML_CUDA=ON   # or your backend of choice
cmake --build build --config Release -j
# Download and run a model directly from Hugging Face
llama cli -hf ggml-org/Qwen3.5-0.8B-GGUF
# Launch an OpenAI-compatible API server
llama serve -hf ggml-org/Qwen3.5-0.8B-GGUF
# A MoE model too big for VRAM - the expert-cache does the work
llama serve -hf <big-moe-model-gguf> -ngl 99 -ncmoe 15 --moe-cache autoDocker: .devops/*.Dockerfile builds from this source tree, so it includes every fix
on this page - the pre-built ghcr.io/ggml-org/llama.cpp images in the
Docker docs are
upstream-only and won't have them. Full guide either way in
docs/build.md.
| Backend | Target devices |
|---|---|
| BLAS | All |
| BLIS | All |
| CANN | Ascend NPU |
| CUDA | Nvidia GPU |
| HIP | AMD GPU |
| Hexagon (in progress) | Snapdragon |
| IBM zDNN | IBM Z & LinuxONE |
| MUSA | Moore Threads GPU |
| Metal | Apple Silicon |
| OpenCL | Adreno GPU |
| OpenVINO (in progress) | Intel CPUs, GPUs, and NPUs |
| RPC | All |
| SYCL | Intel GPU |
| VirtGPU | VirtGPU APIR |
| Vulkan | GPU |
| WebGPU | All |
| ZenDNN | AMD CPU |
Per-backend build flags in docs/build.md.
The mmap-prefetch-safety fix behind the GLM-5.3-Flash result above (skips eagerly populating the whole
model file into RAM when it won't fit) reads /proc/meminfo directly, so it's Linux-only. It doesn't
crash or fail to build elsewhere - Windows/macOS fall back to ggml's own device-memory query, which reports
installed capacity rather than what's actually free, so the fix is less accurate (not absent) at catching the
same OOM there. Verified on Linux; not yet verified on other platforms.
This repo's git history is llama.cpp's history, plus the commits on top. Upstream changes
are pulled in directly rather than re-implemented; nothing here is intended to diverge from upstream's own
architecture or conventions more than a given fix requires. See upstream's
README and
manifesto for the base project this builds on.
Real sources for real ported work, not vendored libraries but genuine prior art this fork builds directly on:
moe-cache-pr branch) — original design for the GPU-resident MoE expert-cache this whole fork is built around. The core feature, not a footnote.fable5/prefetch-experts branch, via the Codacus YouTube channel) — expert-prefetch + lifetime host-pinning, overlapping expert-weight uploads with compute instead of blocking on them. Cherry-picked and re-measured on our own hardware: +36.0% prefill (1403 → 1908 tok/s, RTX 3060, Gemma-4-26B-A4B).ggml_backend_sched_compute_splits rather than porting its CUDA kernels directly — the residency check and device-to-device copy are ours, keyed off the same cache the decode path already fills.Prior art that shaped decisions here without code being taken — including several that told us not to build something:
transparent_hugepage=always
already covers a plain malloc buffer without code changes. Both explanations are ruled out here,
not confirmed by assumption — the negative result stands for a different, still-undetermined reason.Third-party libraries, inherited unchanged from upstream:
llama-server — MIT